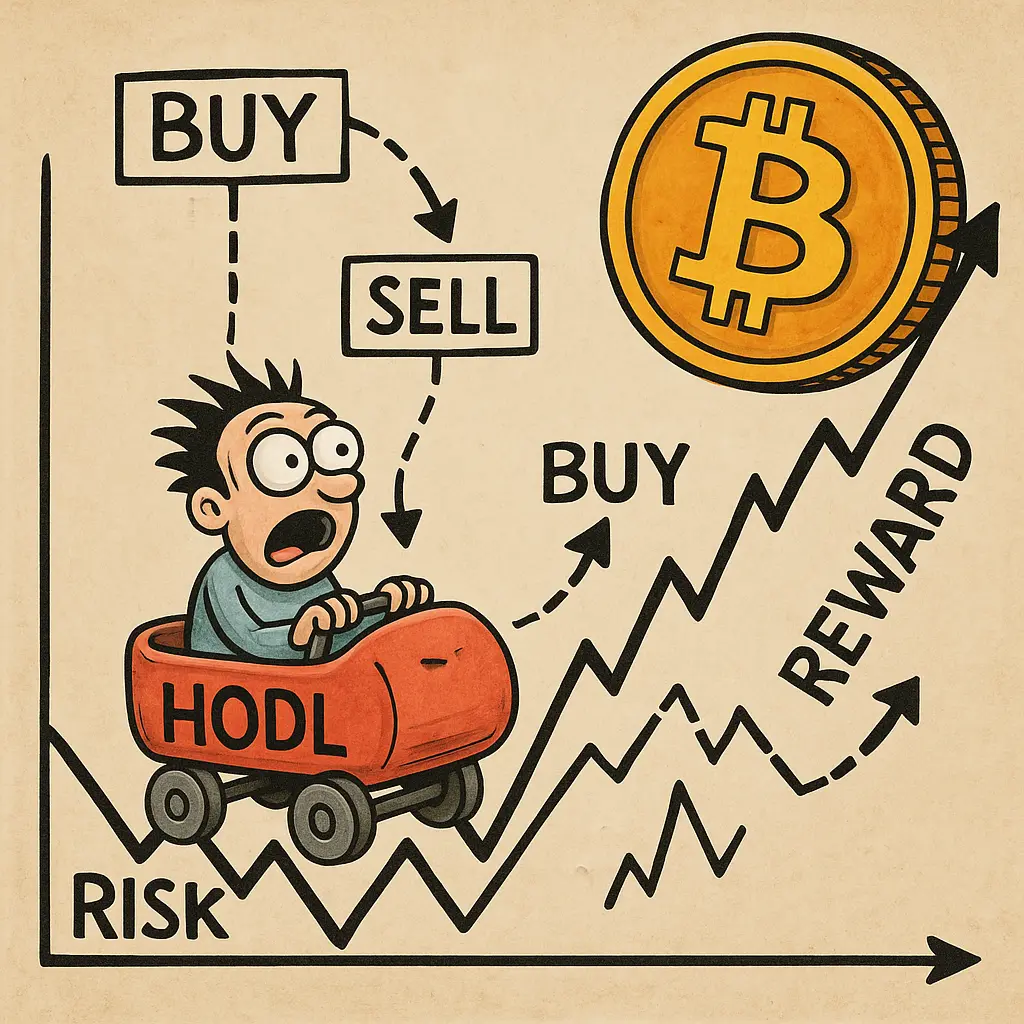
How to Improve Bitcoin HODLing with Trend Following Trading Strategy
Bitcoin as a prominent cryptocurrency has experienced unprecedented growth in the past decade. It has become an accepted asset class to diversify investor returns (along with some other major cryptocurrencies). The question is whether using simple trading rules can improve the risk-adjusted return of such a portfolio.
Baseline: Buy-and-Hold Bitcoin Strategy
Those lucky enough to have bought Bitcoin for $3 in 2011 would have done much better just holding onto it rather than using any trading rules.
For those of us who did not make such a prodigious investment and will (with most probability) not experience growth of similar proportions, we are playing a game of trying to improve the risk-adjusted returns of an asset.
Here is how to simulate a buy and hold strategy for Bitcoin to create a benchmark1 we will try to beat. We go to the strategy builder where we define a simple entry rule which will always be true. Hence, once we enter at the beginning, we will never exit, effectively simulating a buy-and-hold2 strategy.
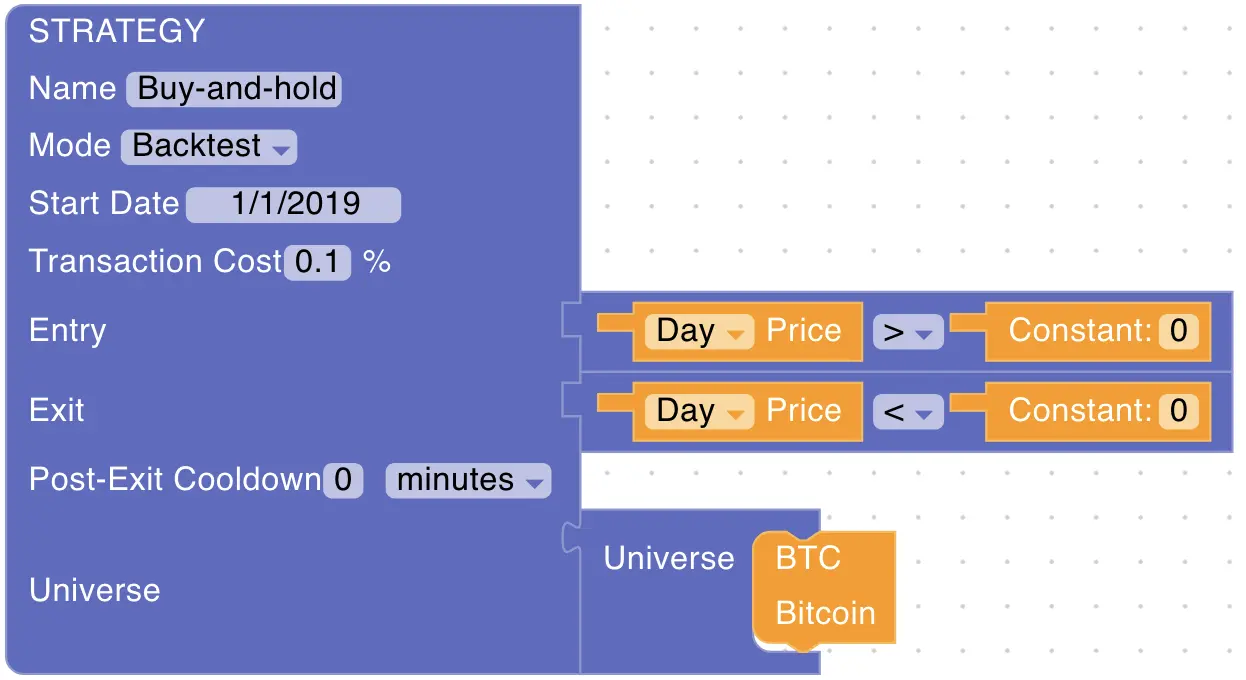
Strategies can only be saved by registered users. You do not, however, need to be a paying user; free registration is enough to be able to save a strategy (otherwise it would be impossible to assign a strategy to the user).
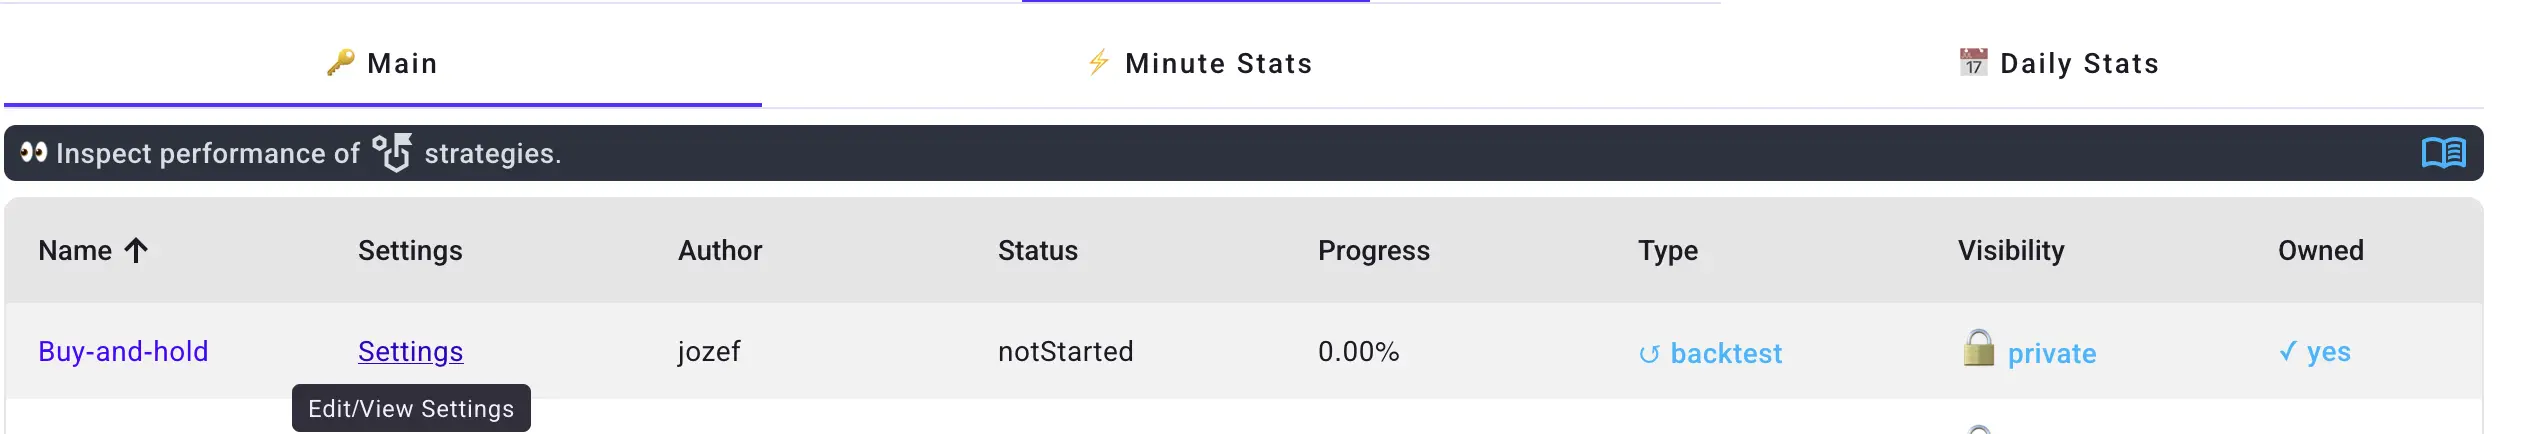
Once the strategy has been saved, it is available in the strategy screener. Since we have not yet run a backtest, no statistics are available yet. We can now go to strategy settings as shown in the picture below.
This leads us to the settings inspection screen, where multiple actions for the backtest are available as shown in the picture below.
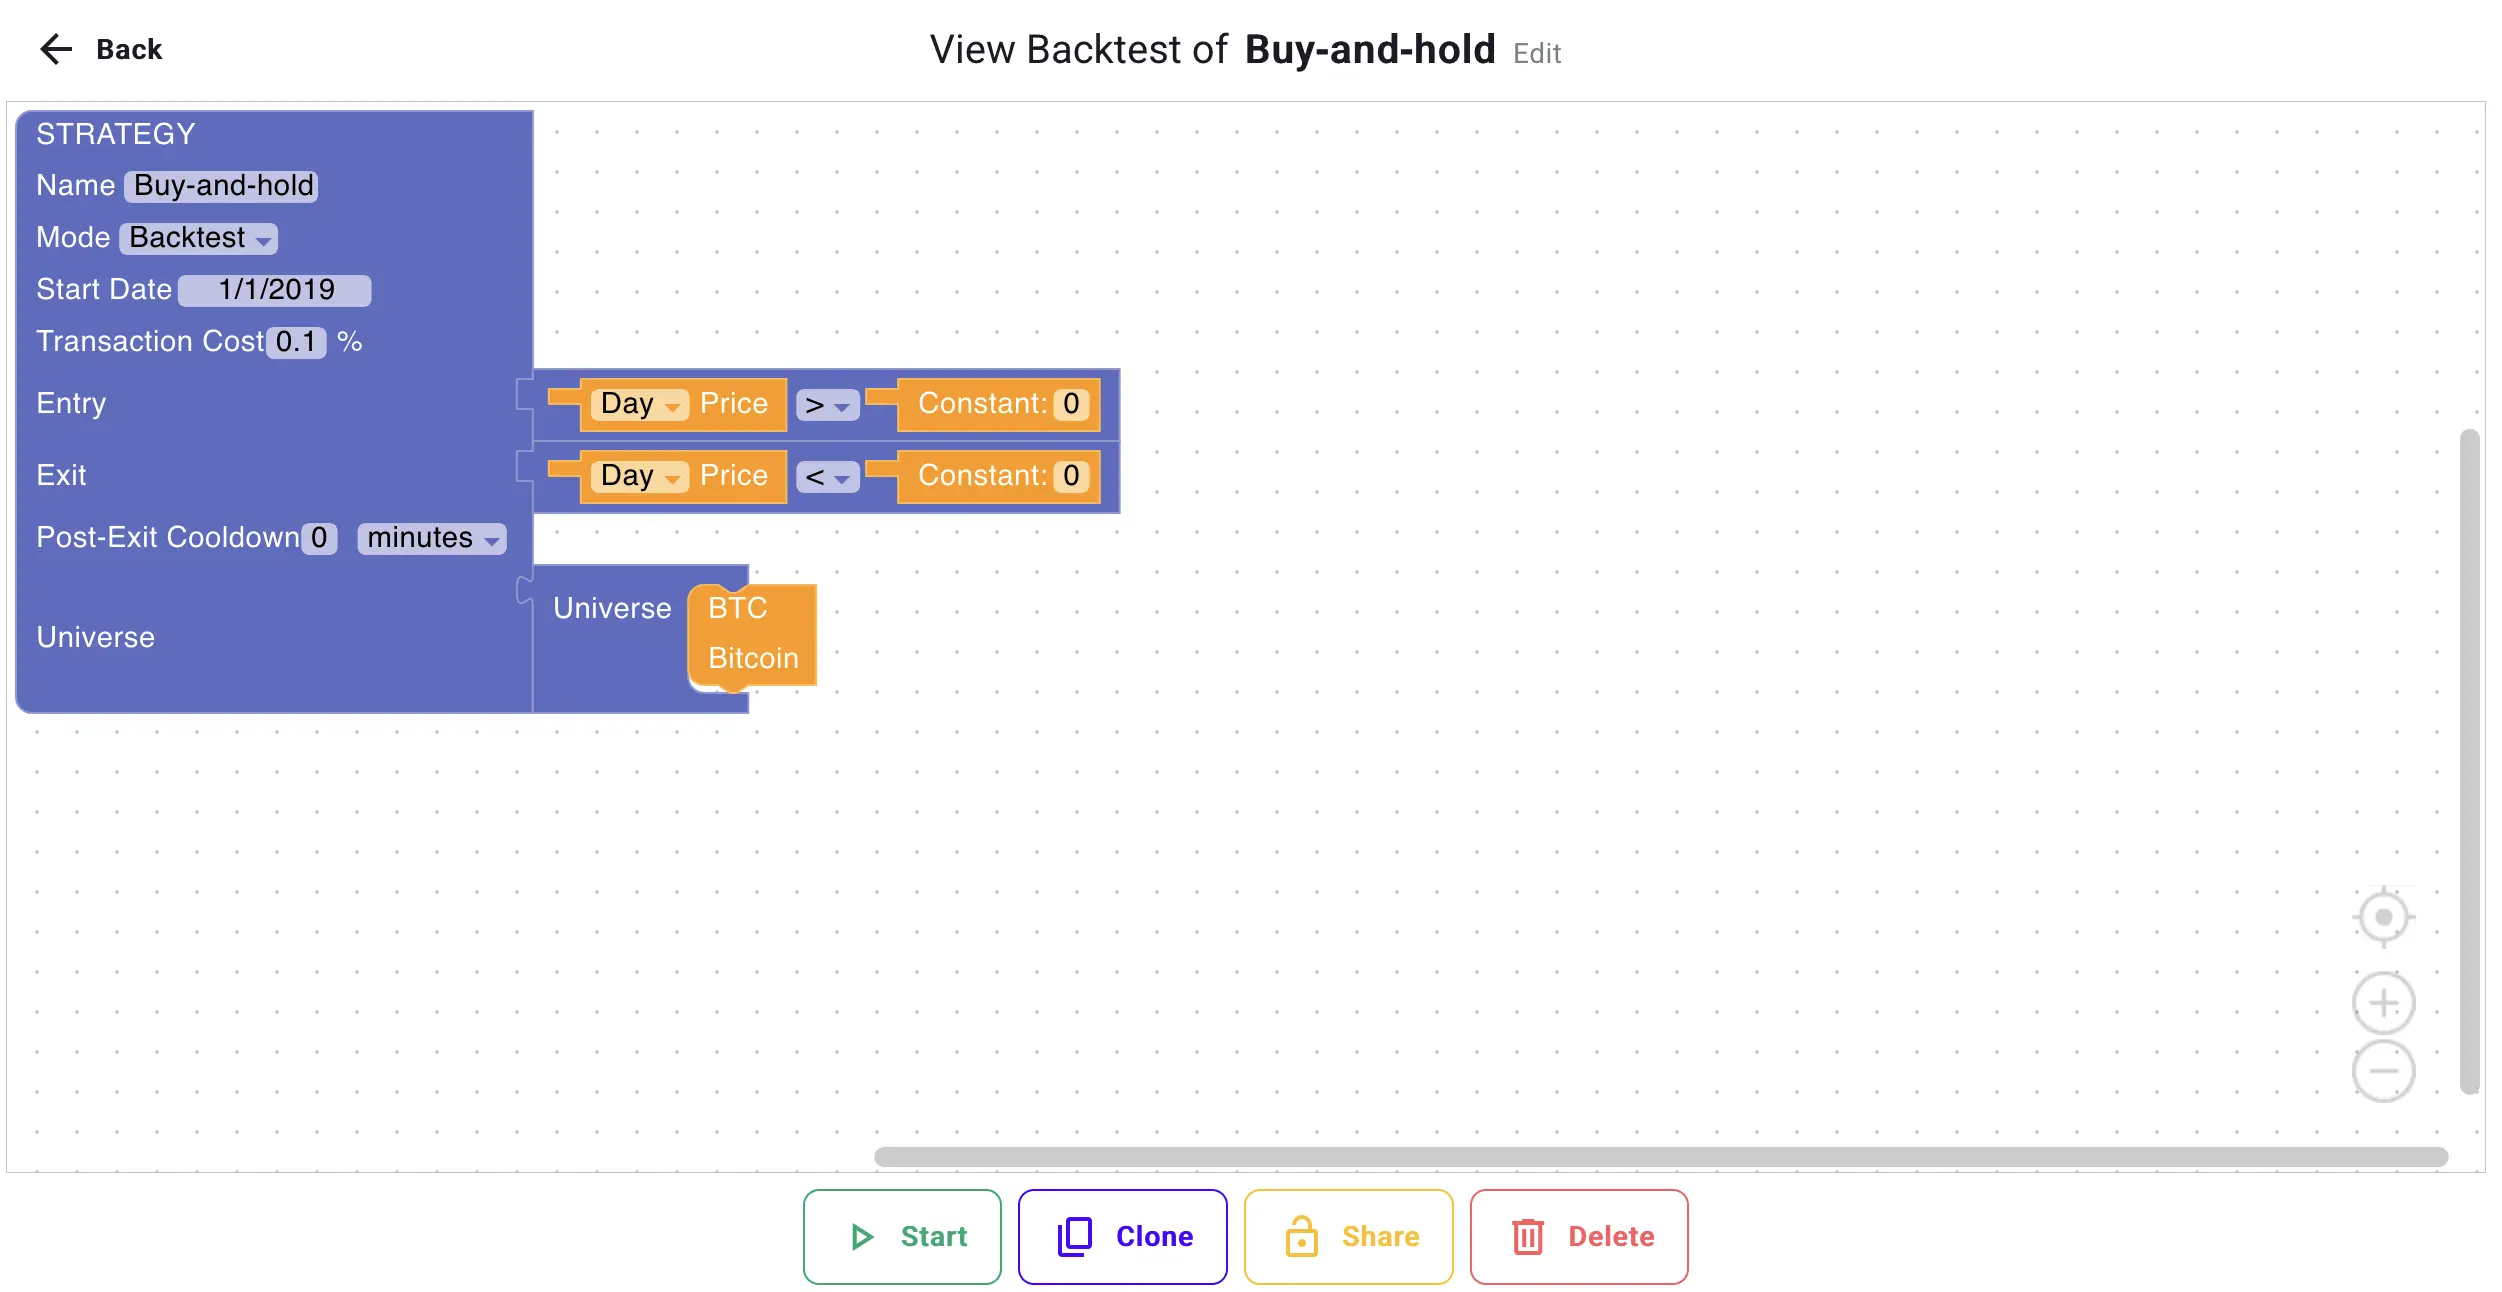
Available actions should be self-explanatory:
- Start will start a simulation.
- Clone button will create a strategy clone, which the user will be able to edit further before saving. Convenient if user wants to experiment with similar trading rules of already saved strategy.
- Share button will make strategy visible to all the other users for inspections. Hence, if user wants to show other users his strategy, it can be done so. If user changes his opinion, then he can unshare it.
- Finally, strategy can be deleted.
Let's go ahead now and press the Start button to begin a simulation. You can monitor progress in the strategy screener section. Progress is updated once per minute, so let's wait until the simulation is finished as indicated in the picture below.

Once finished, let's inspect the results. Relevant strategy statistics are available in Daily Stats pane of the screener table as indicated on the picture below.
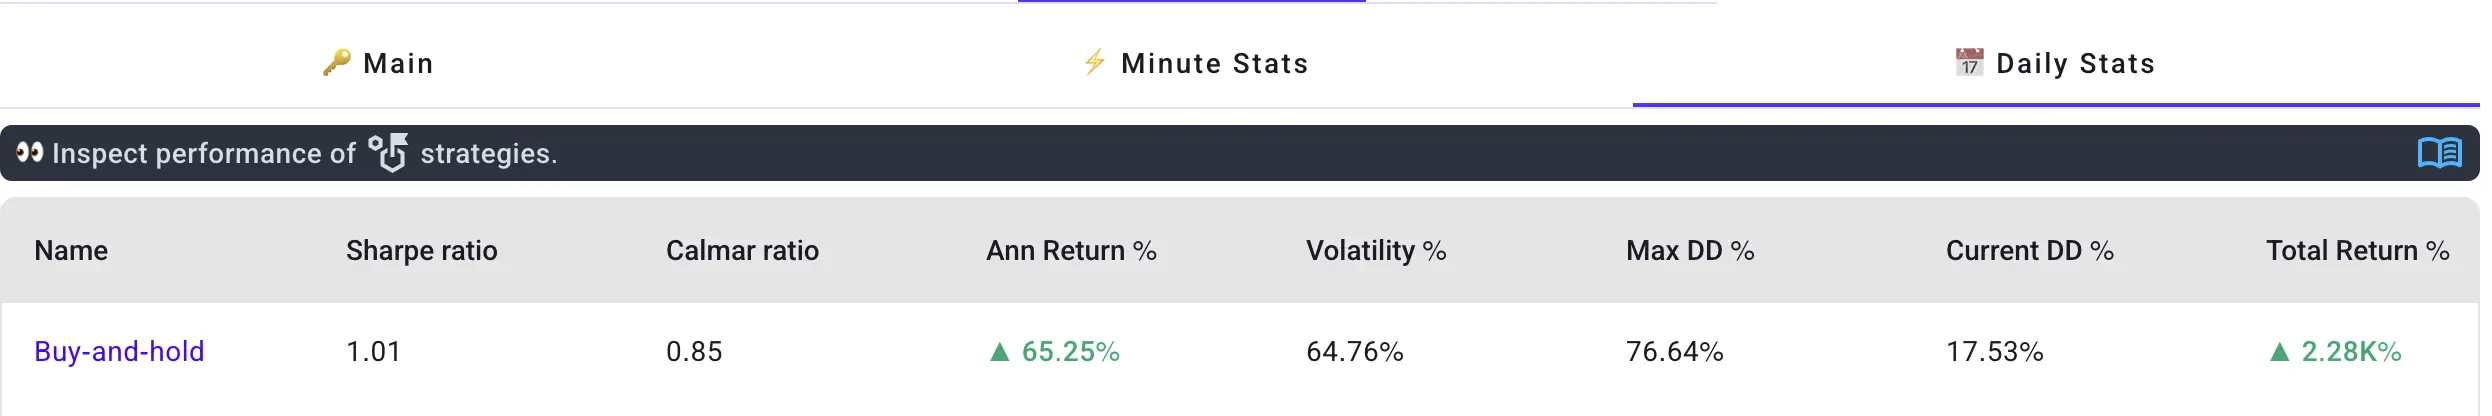
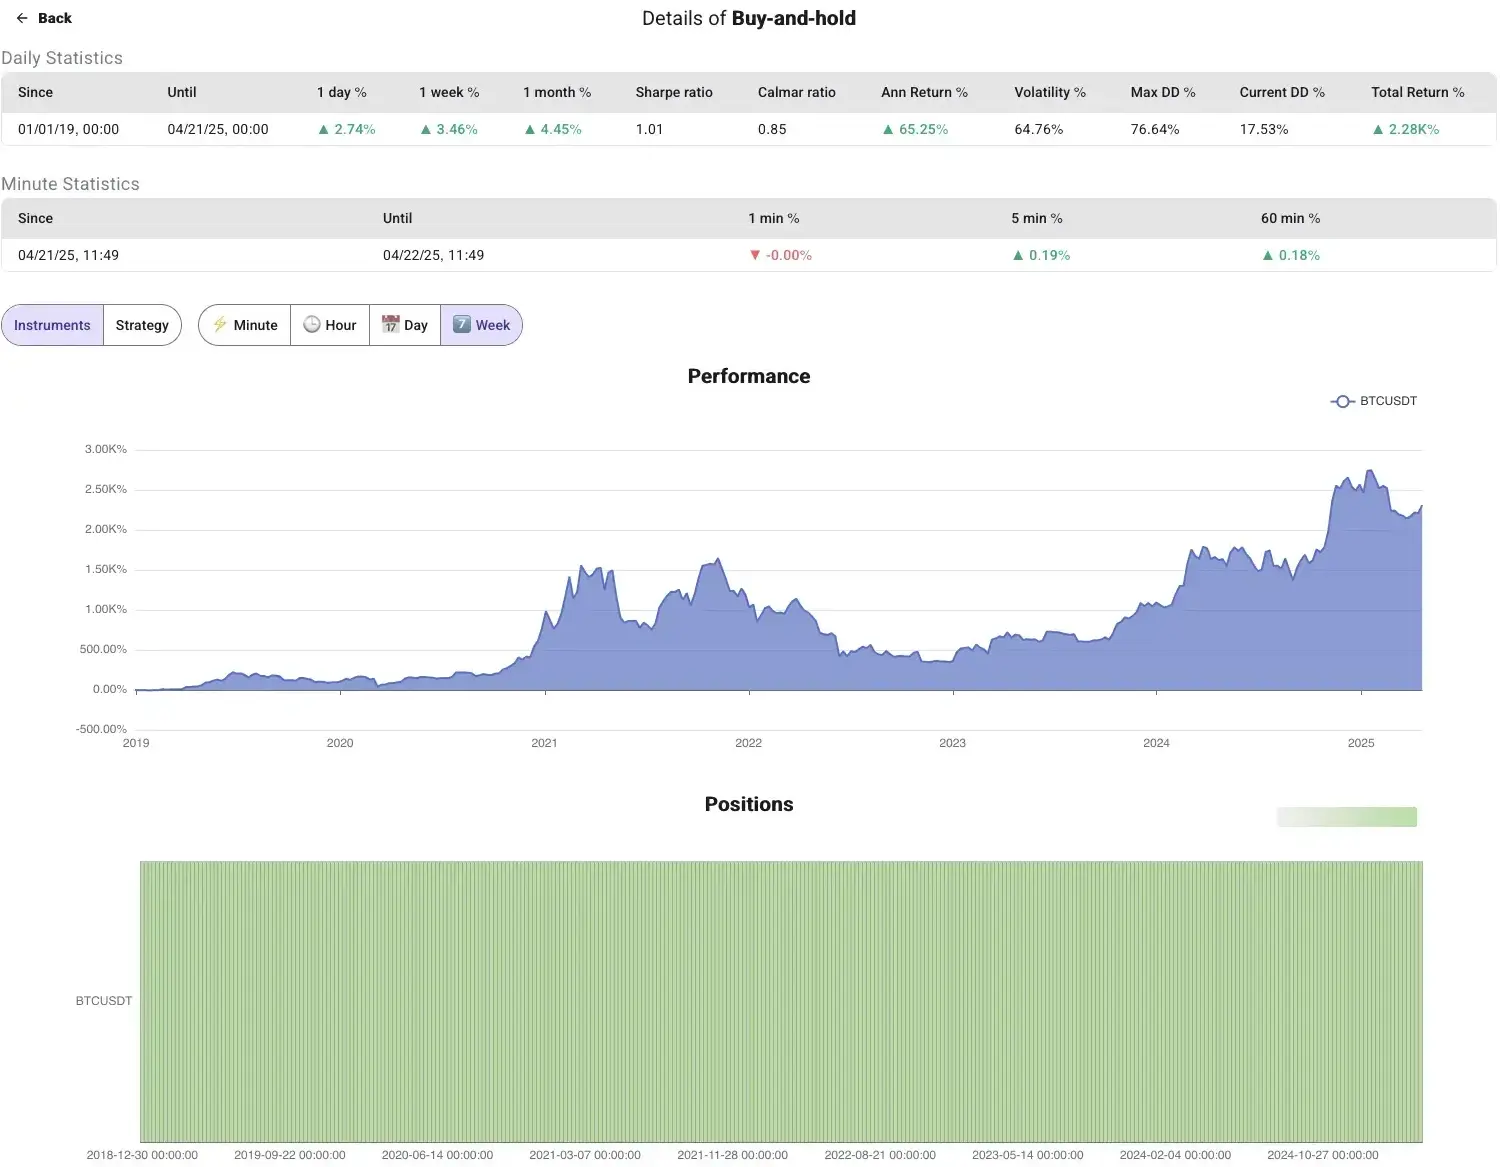
To inspect results more in detail with relevant charts, click on the strategy name in the screener table.
By now it should be clear what the process is to test trading rules. Free registered users can define any amount of strategies, but are limited to running 2 simulations in a 24 hour window.
Next, we will try to develop a strategy which is better than just holding Bitcoin. To be more precise, "better" means a strategy with a better risk-adjusted return as expressed by Sharpe3 and Calmar4 ratios. Both ratios express how much risk an investor had to stomach for a unit of return (they differ in what they consider to be risk).
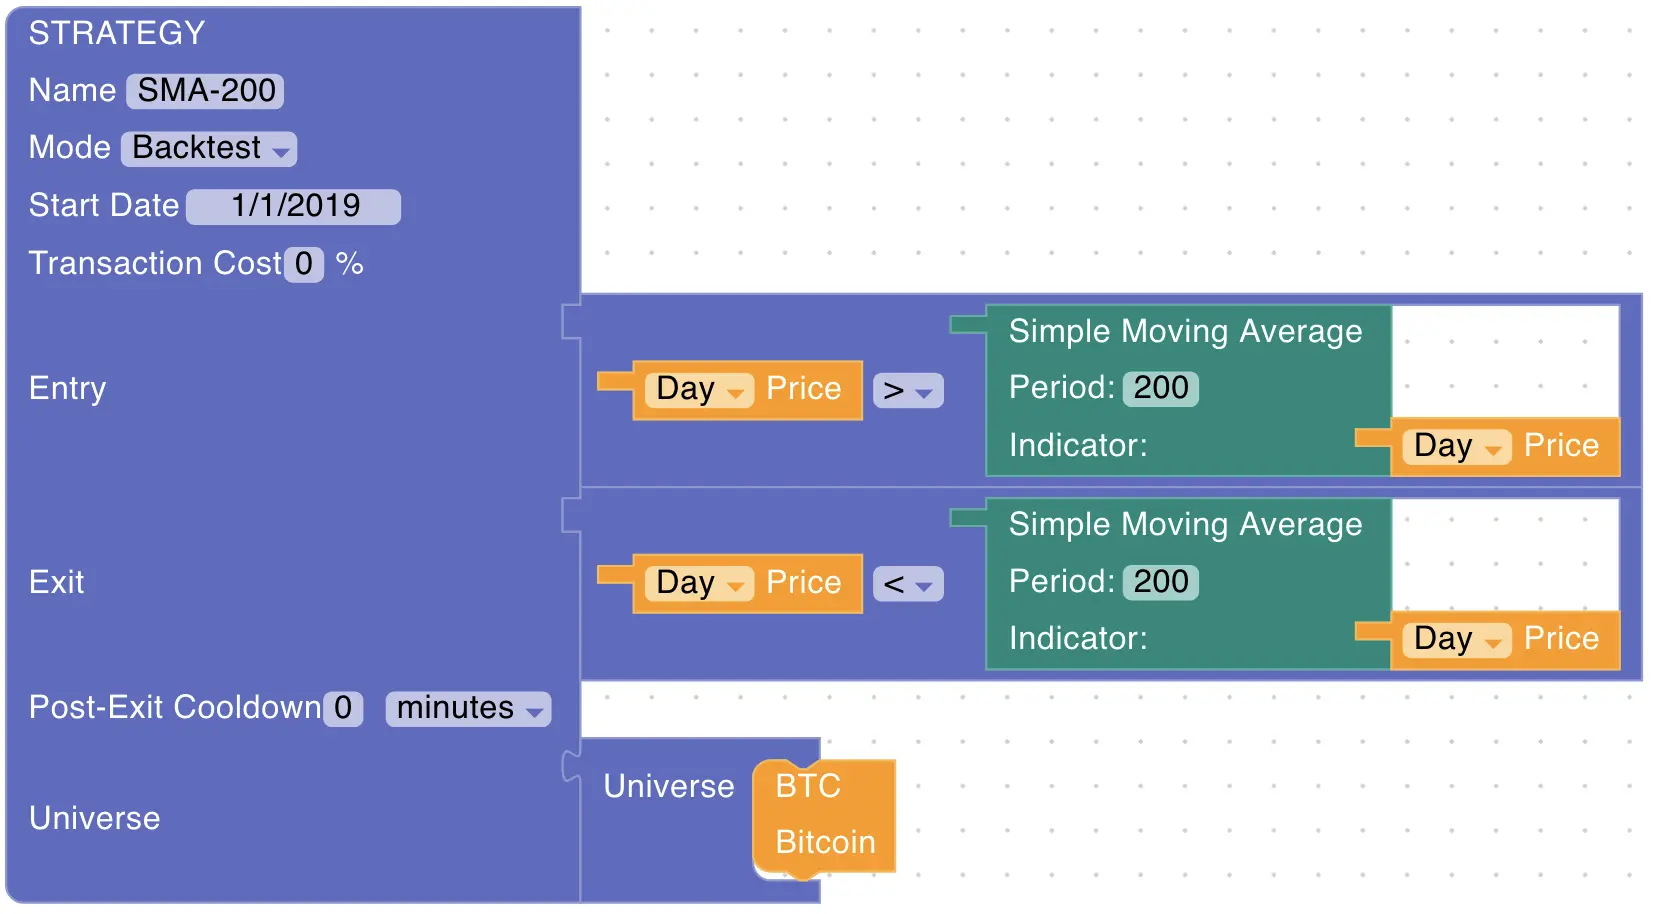
Strategy #1: 200-Day SMA Trend Following
In a similar way to what we described above for the buy and hold case, we define the simplest indicator. Our objective is to decrease downside risk and be in the market only during long-term uptrends as shown in the picture below.
The results of this simulation are shown in the picture below.
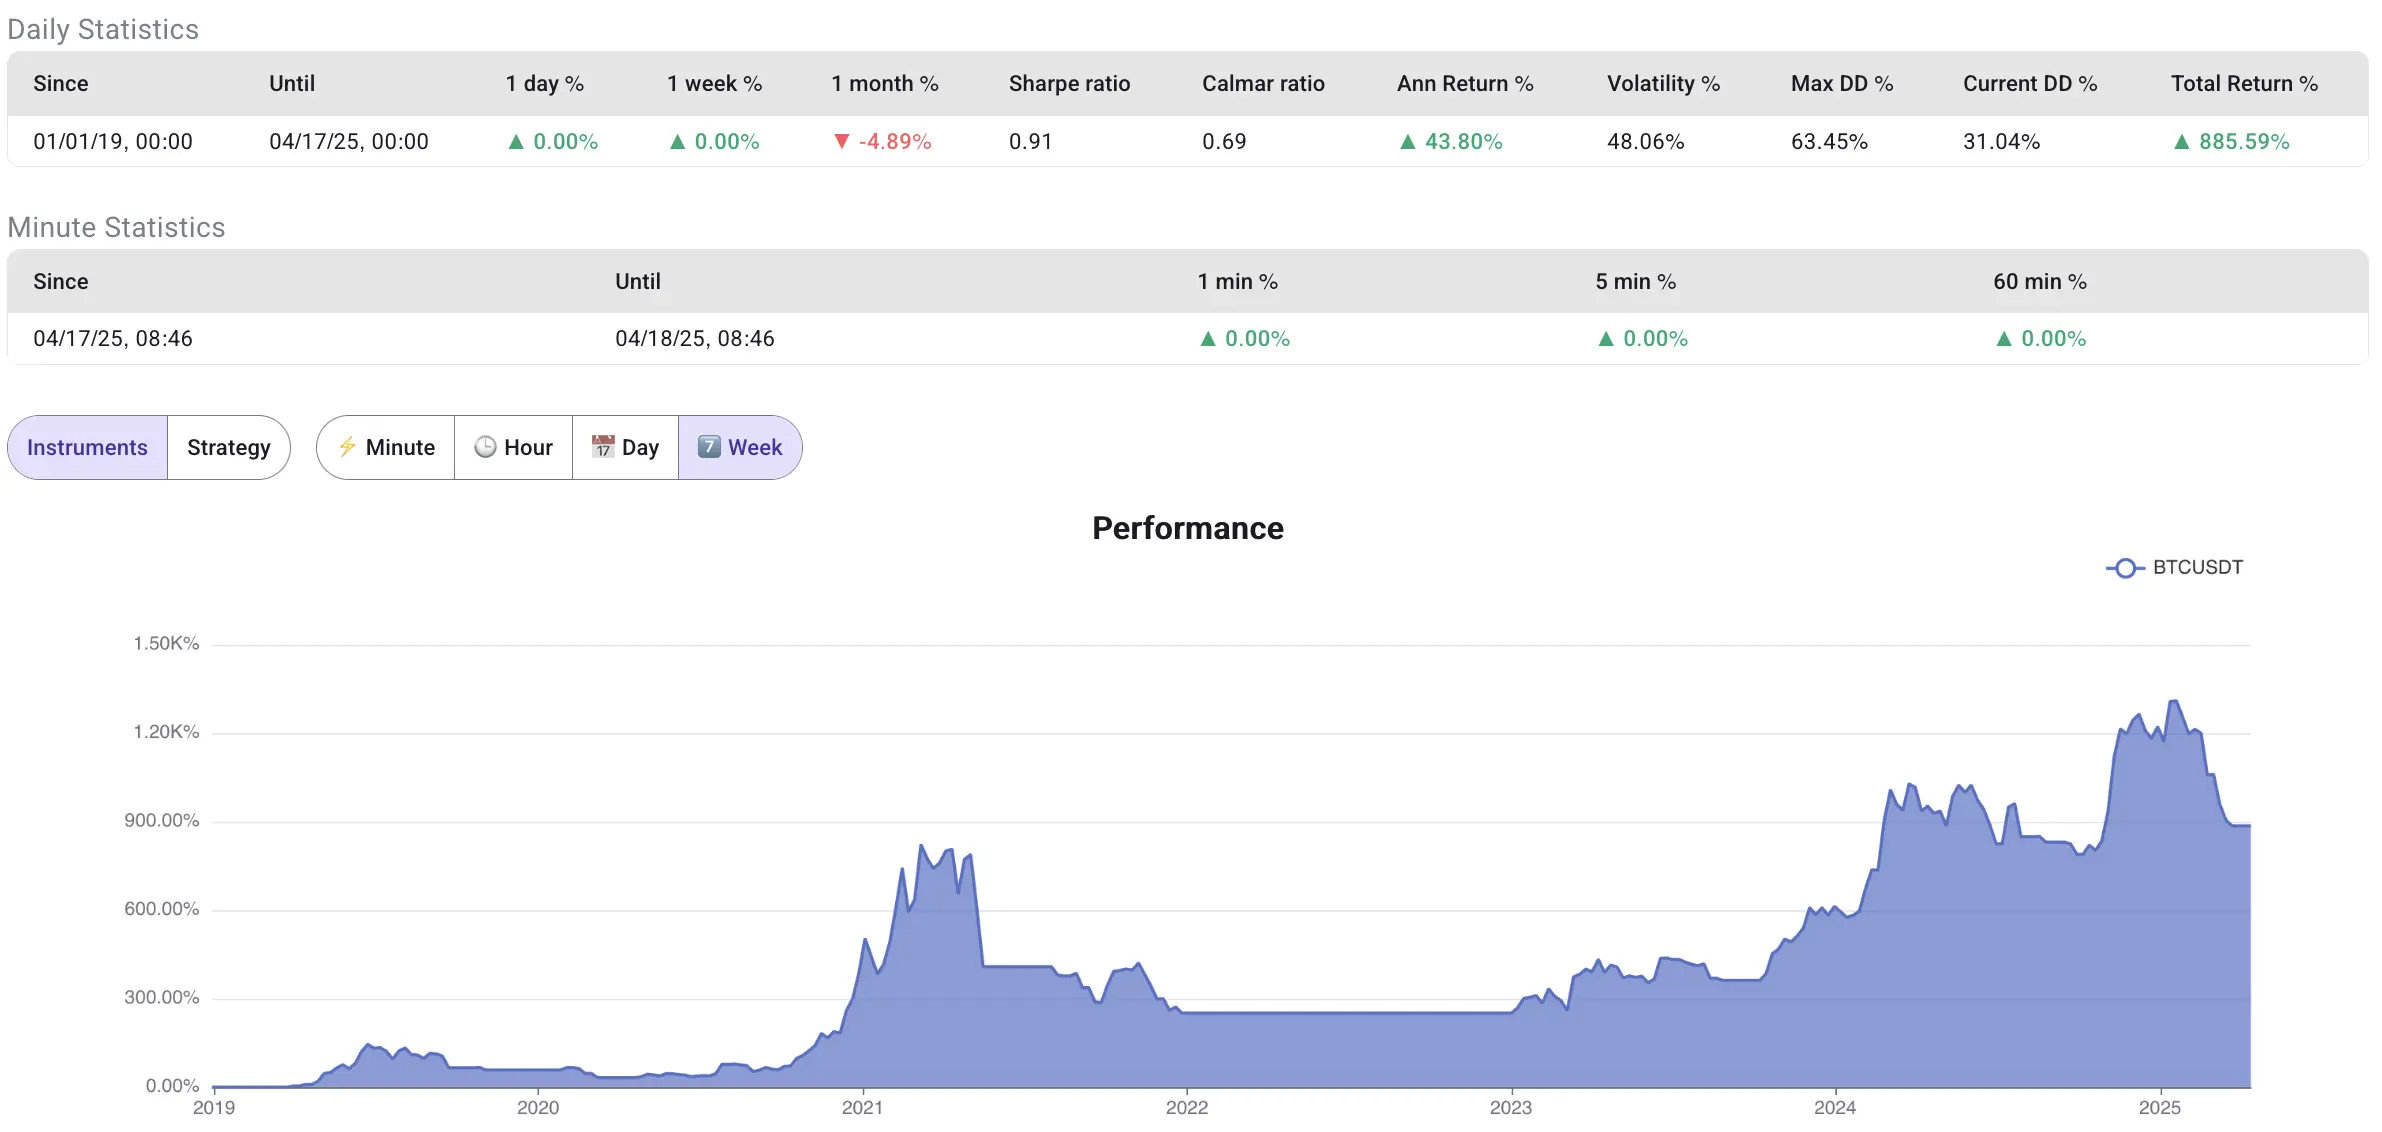
As is obvious from the comparison of both ratios (Sharpe and Calmar), the risk-adjusted returns are worse than those from the simple buy and hold strategy (e.g., 0.91 vs 1.01 for Sharpe ratios).
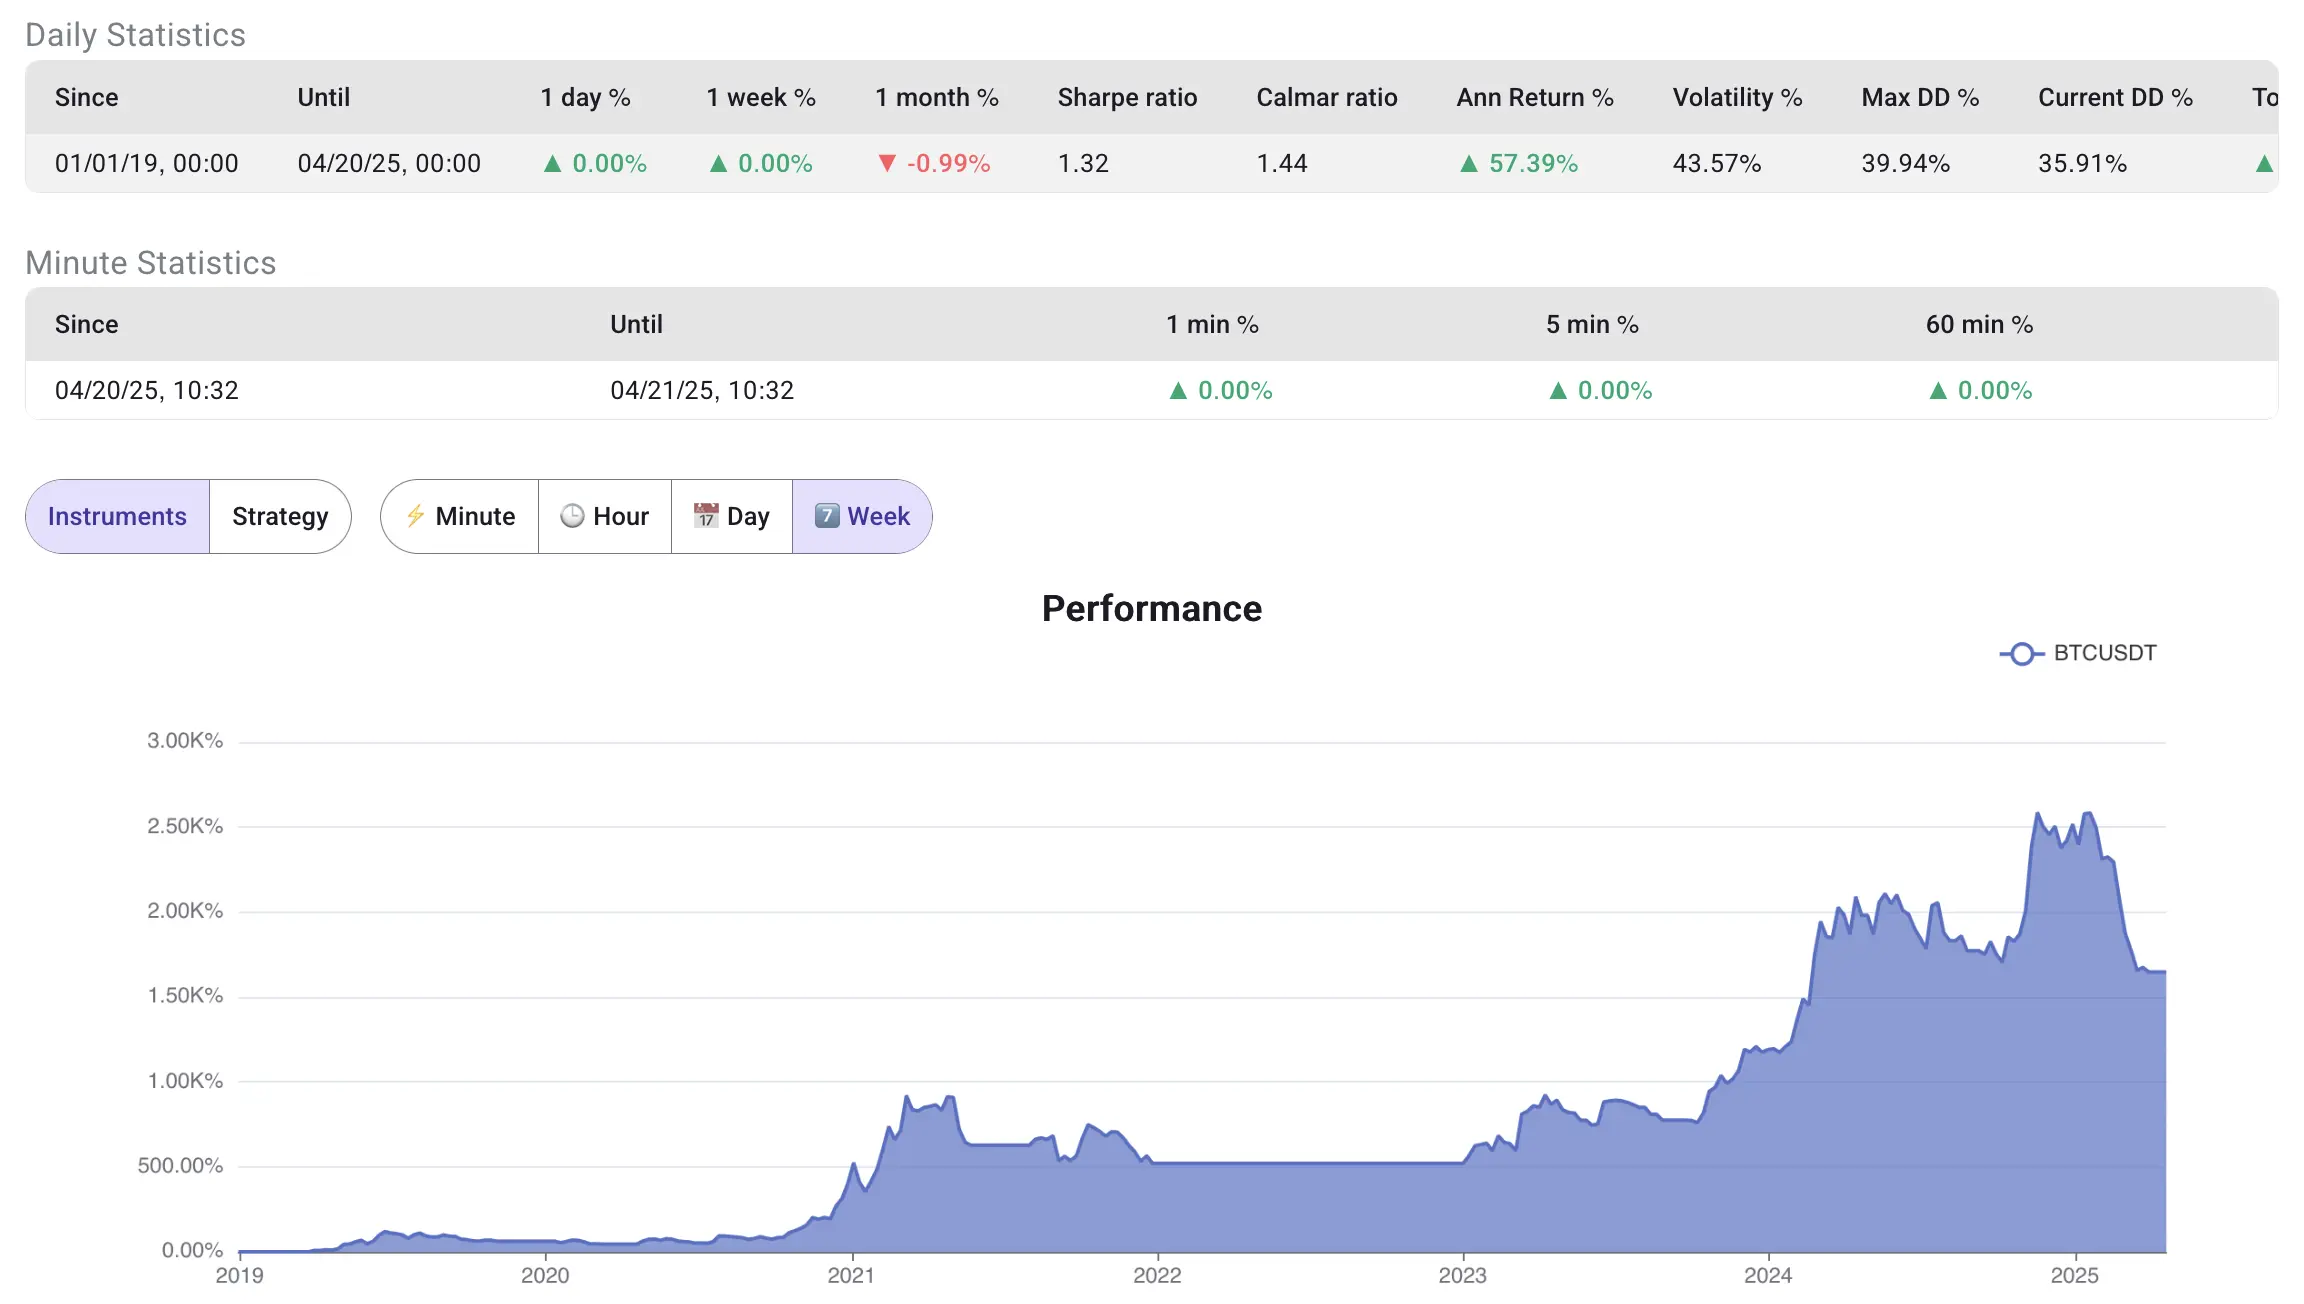
Strategy #2: 200-Day SMA At Minute Frequency
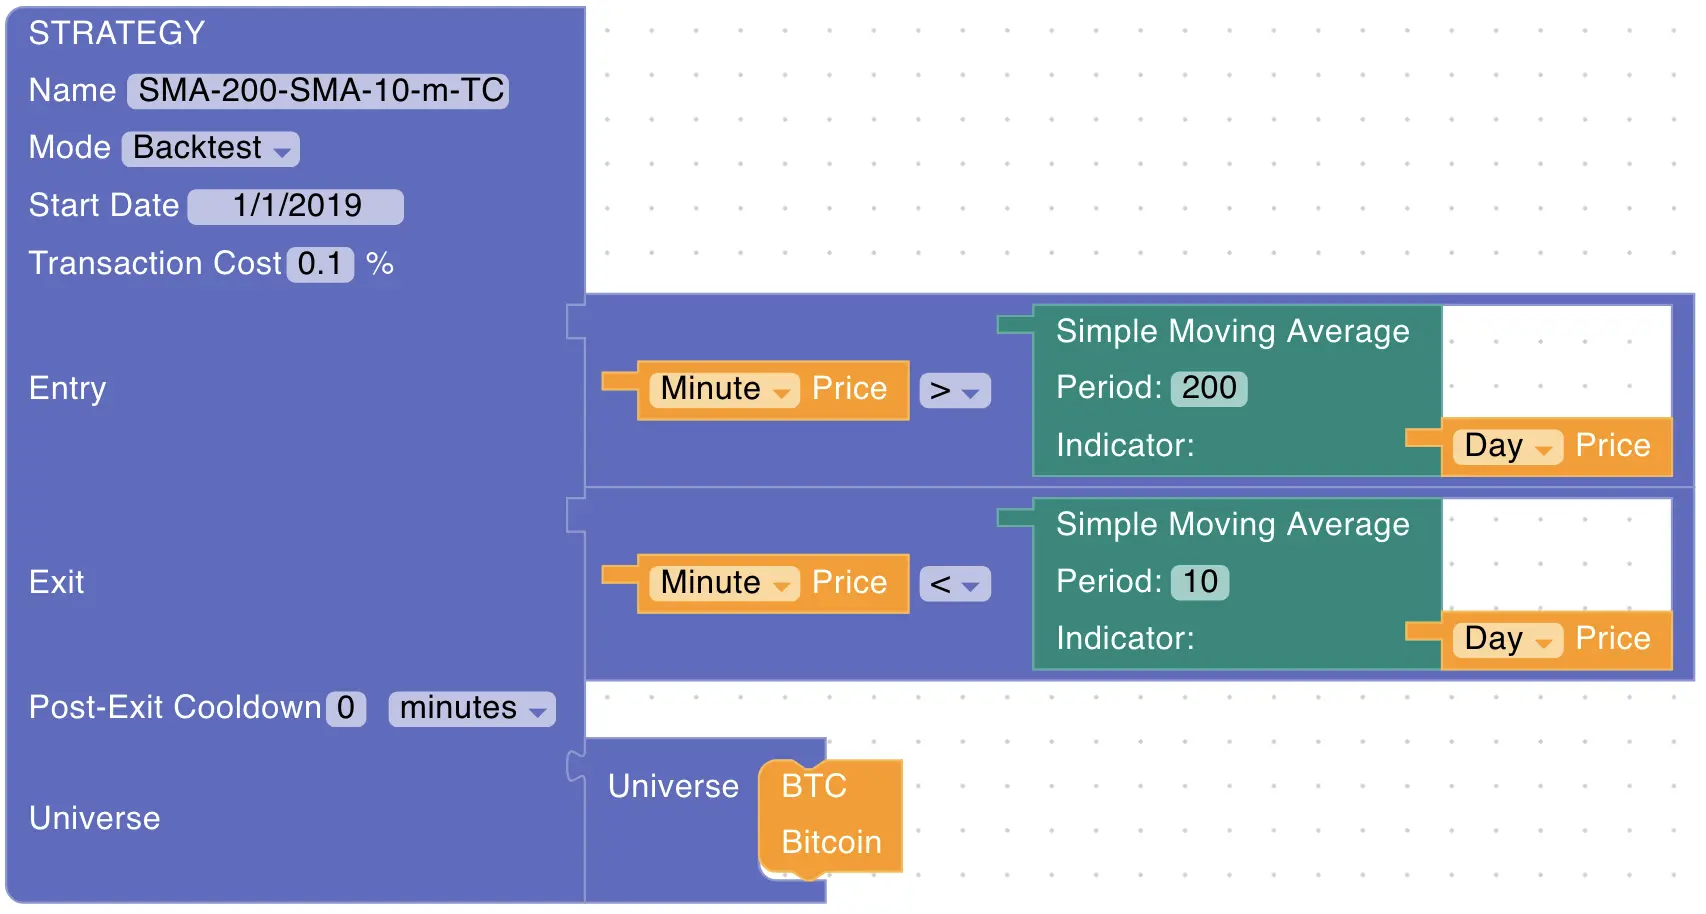
Our backtester allows us to use even minute frequency so we can try to make more sensitive rules, as the crypto market is fast-moving. We define rules where a minute price is compared to the 200-day moving average to go long, but we exit quickly whenever a minute price falls below the 10-day moving average. Strategy rules are shown below for clarity.

Let's inspect the results below. We have now achieved superior risk-adjusted returns as indicated by a Sharpe ratio of 1.32 and a Calmar ratio of 1.44. In other words, an investor would need to weather a significantly smaller drawdown of only 39% to collect a only slightly smaller annualized return of 57%.
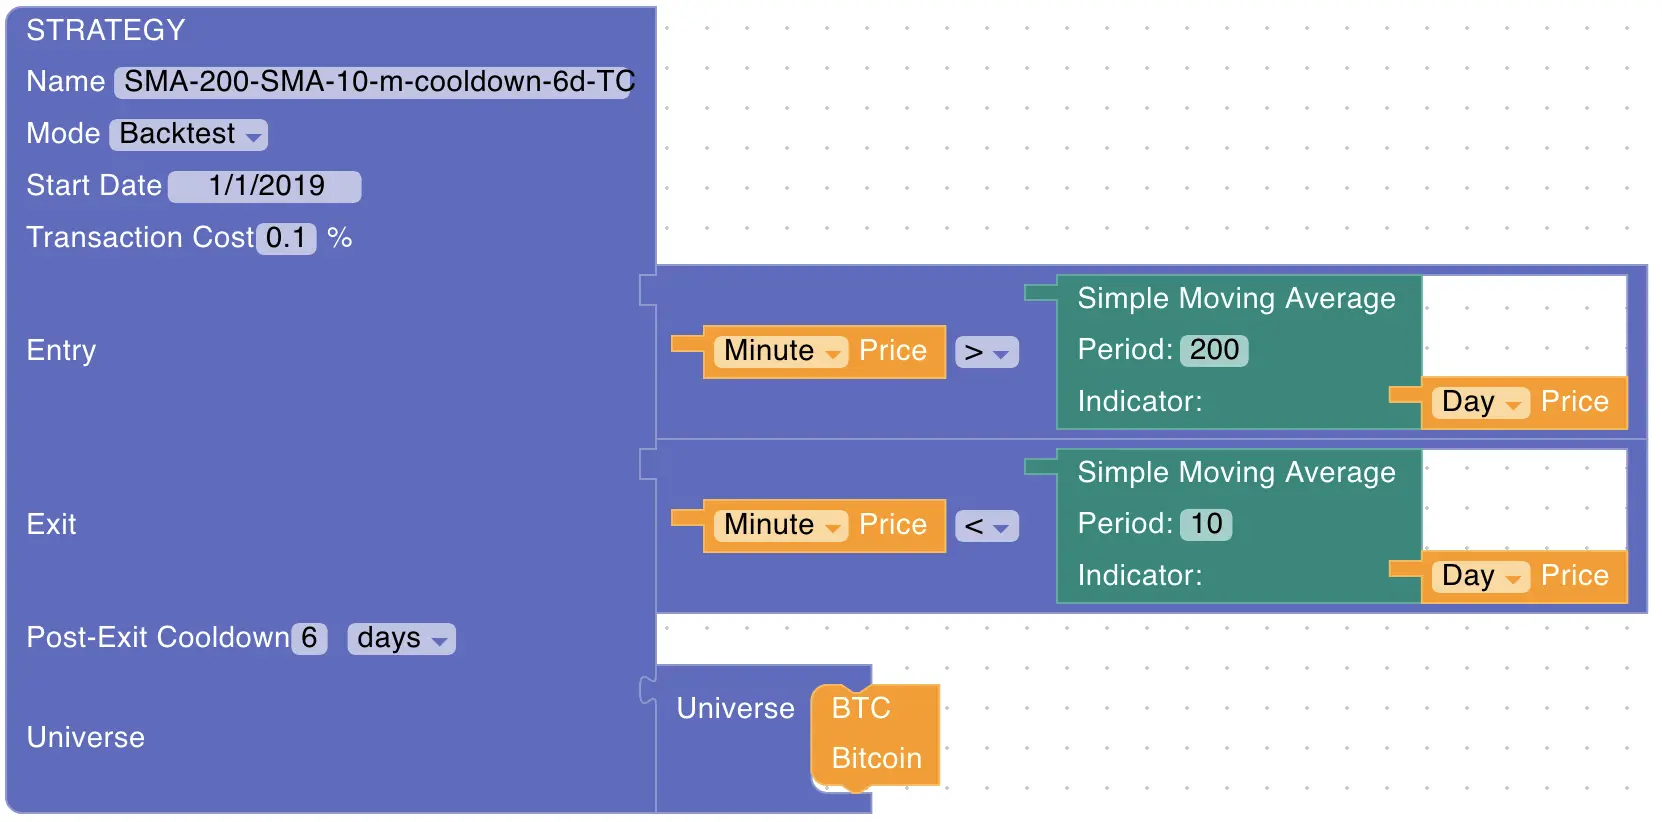
Strategy #2 with Transaction Costs Applied
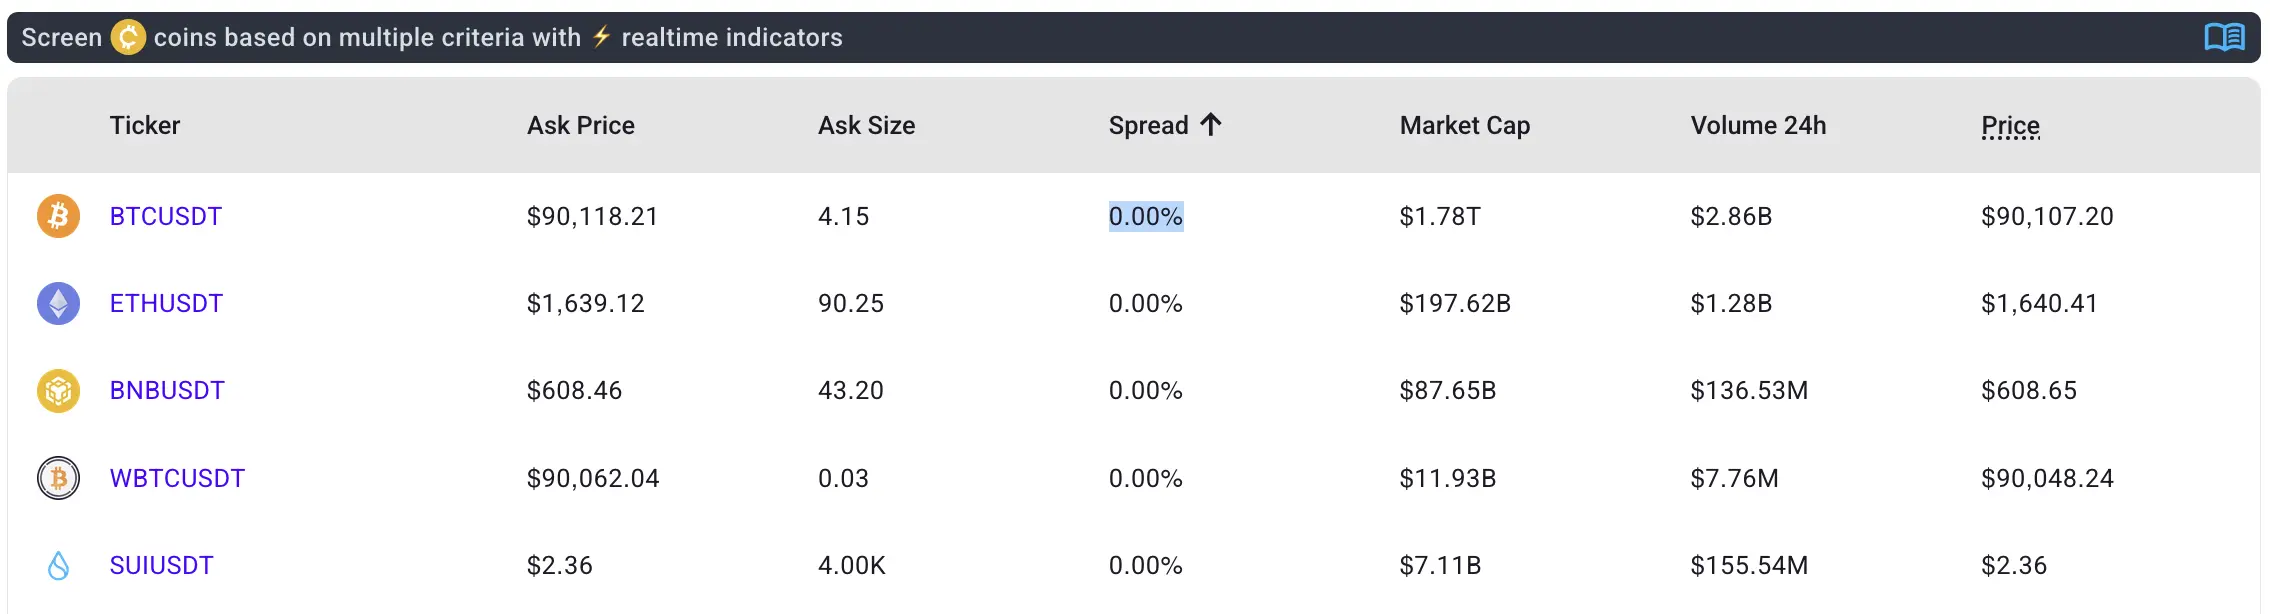
Let's introduce more realism into the simulation. The Bitcoin market has a very narrow spread, and it should be relatively cheap to get into and out of positions as indicated in the picture below. You can inspect bid-ask spreads in our screener.
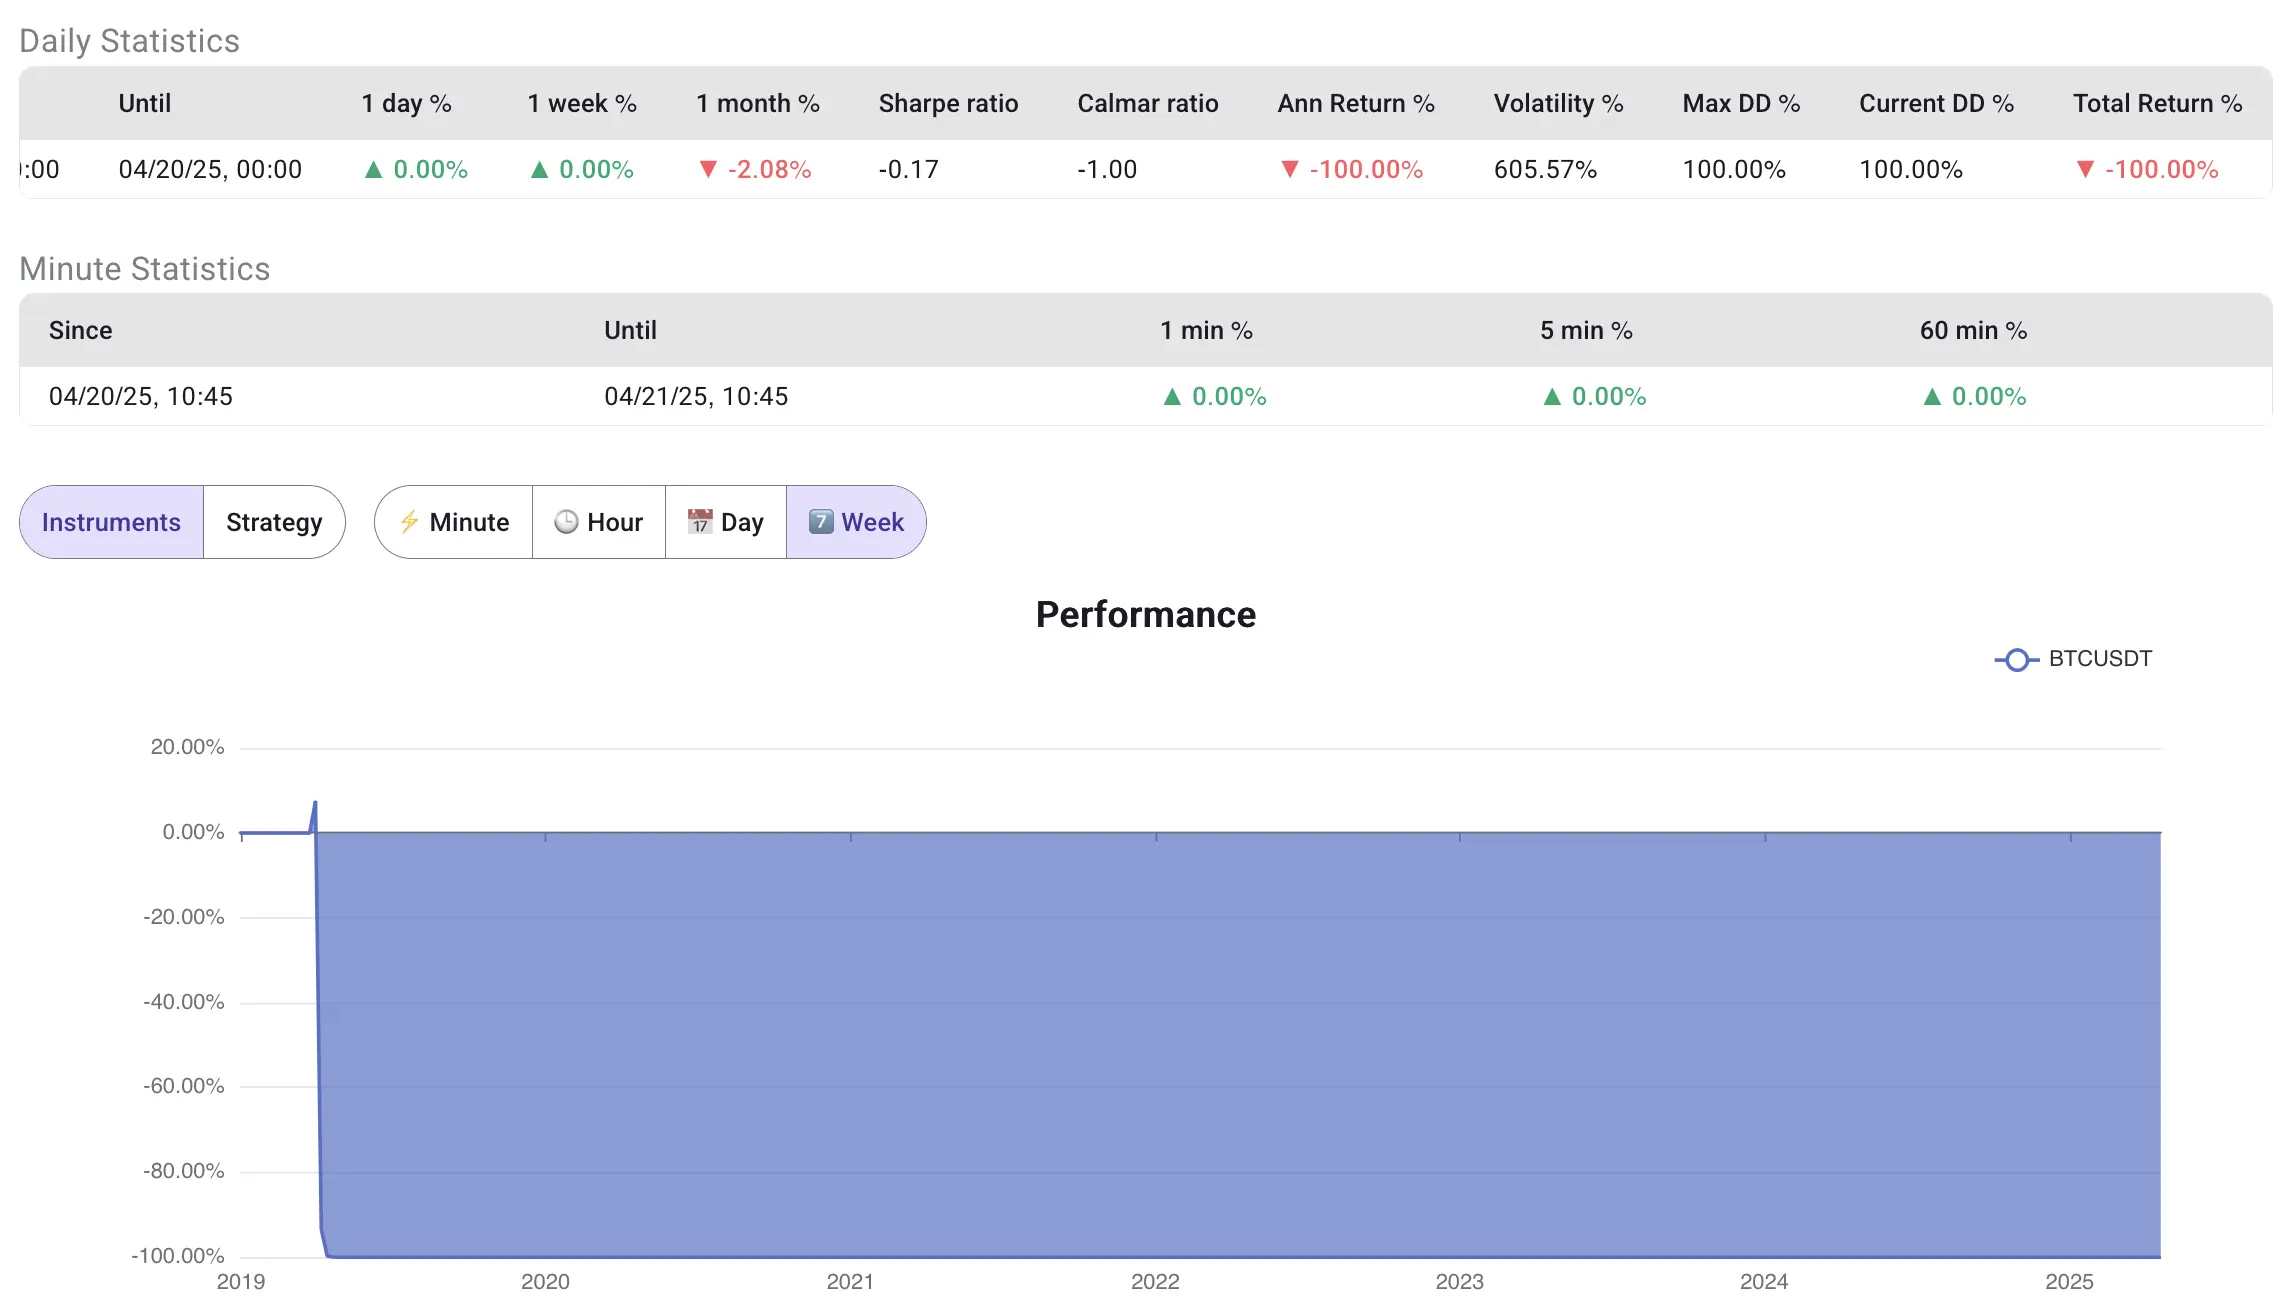
But exchanges usually charge transaction costs as well, so let's be conservative and introduce one-way transaction cost of 0.1%.
Hence, I will clone strategy from previous section 200-day ma with a twist (picture below).
Unfortunately, the results are very bad, and the trader would have lost all their money due to excessive trading even with a transaction cost of only 0.1%, as illustrated below.
Optimizing: Reducing Over-Trading via Cooldowns
Next, we will use a post-exit cooldown setting, which, after an exit is triggered, will not allow us to enter for a defined period of time, effectively preventing the zig-zag pattern of excessively entering and exiting positions.
Results now are much more encouraging as is evident below.
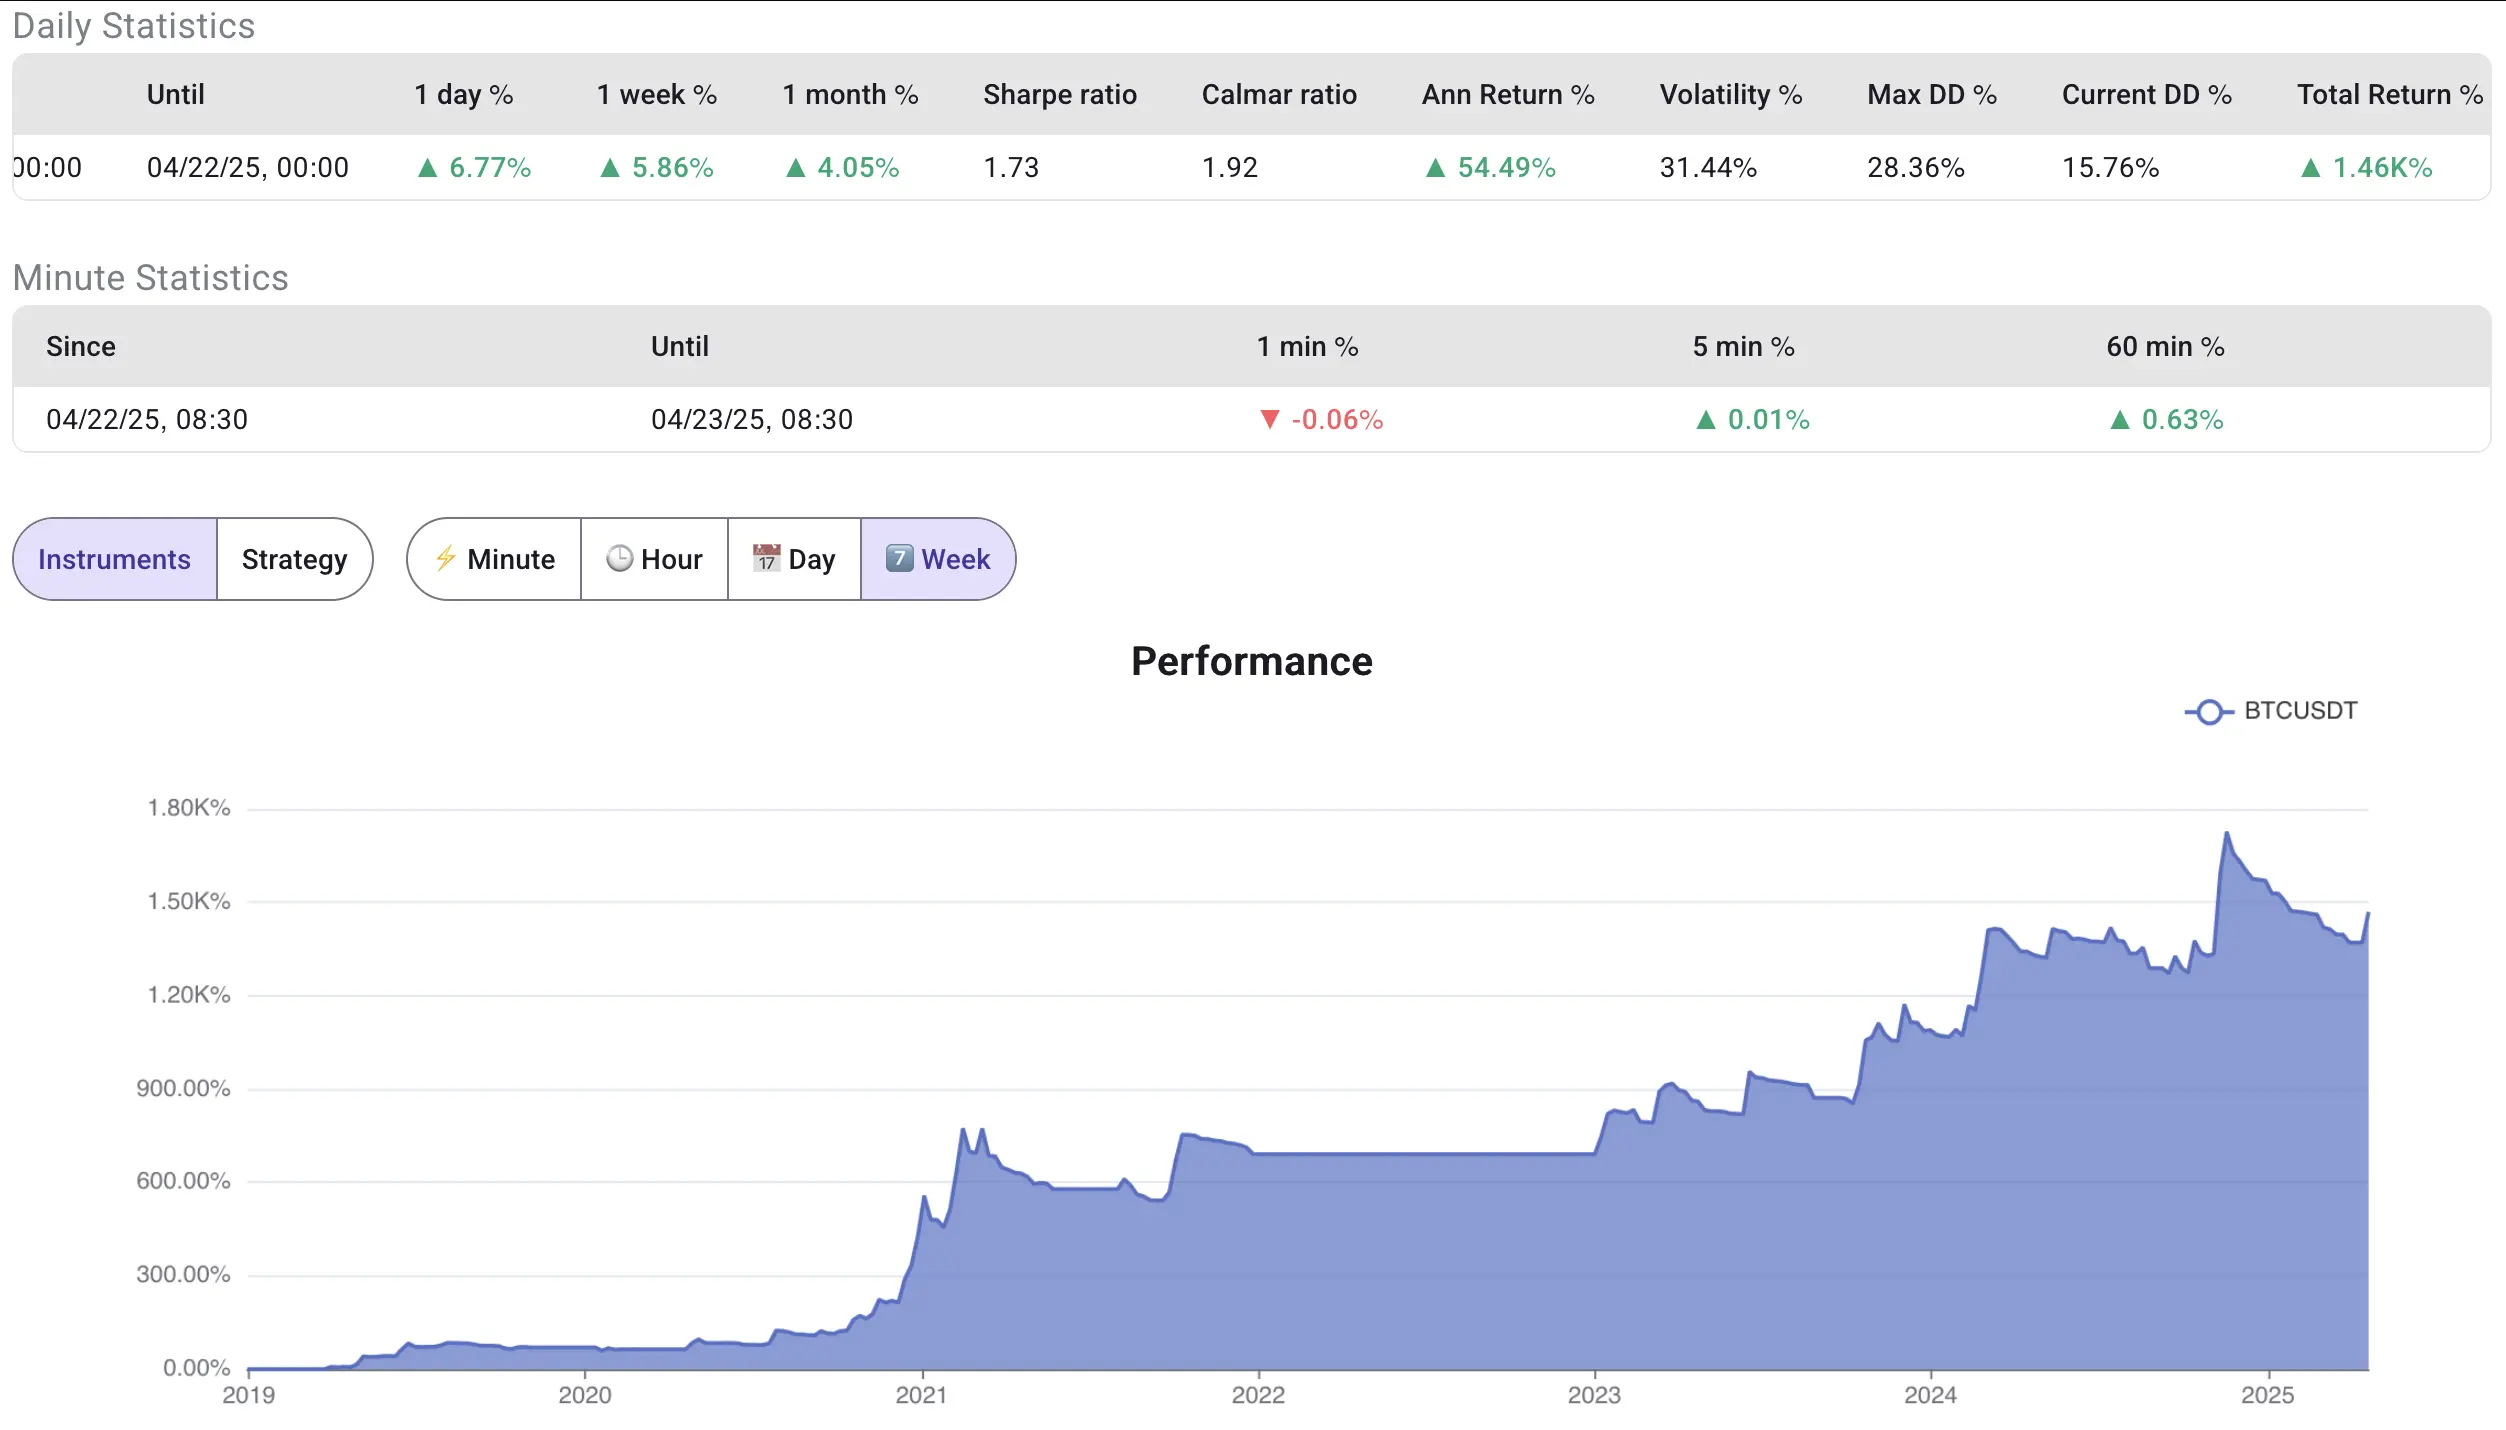
We have effectively doubled the Calmar ratio from 0.84 to 1.92, thus keeping the maximum drawdown5 contained at around 30%, compared to almost 80% for the buy and hold case.
We can inspect weekly positions chart below.
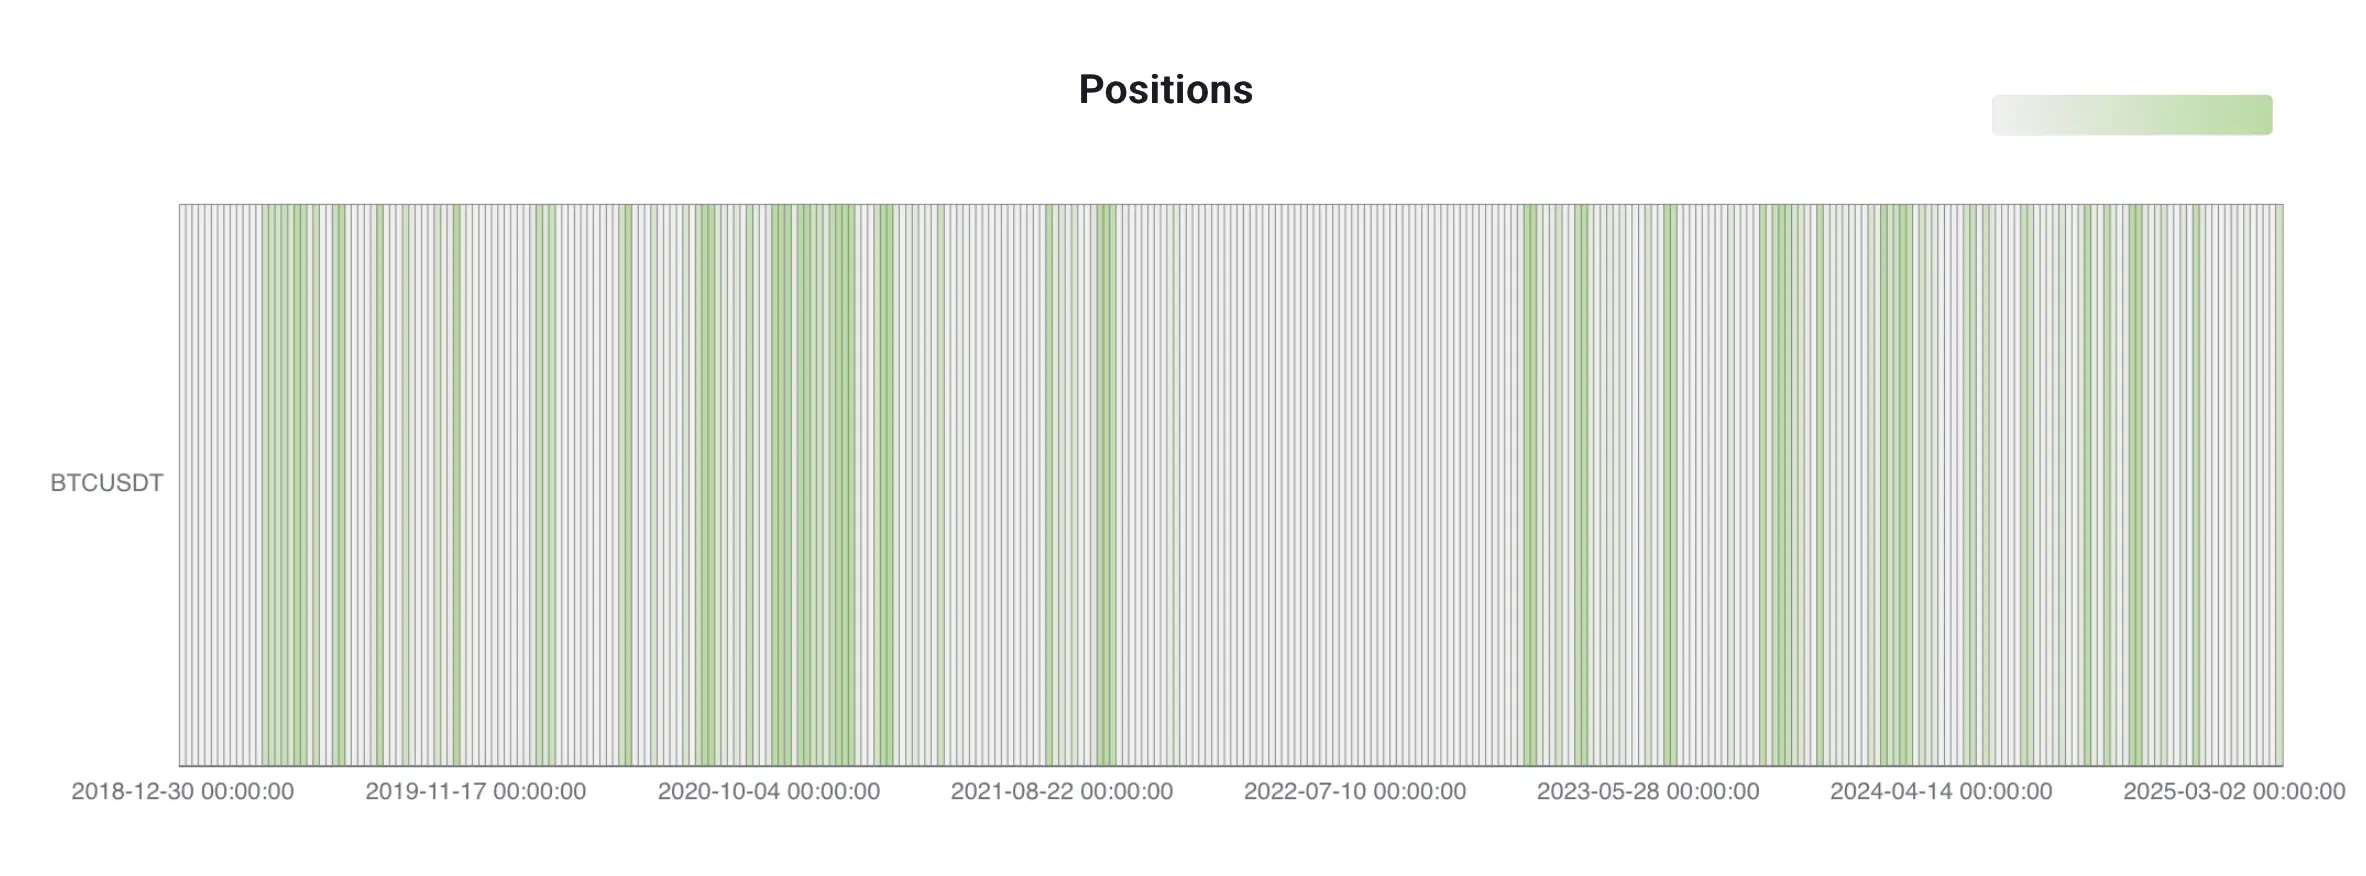
It's clear that we were not in the market very often, thus profiting during market upsides and staying in cash during sideways or downward-trending markets. In practice, we could have allocated the cash to money-market funds or similar instruments, but for simplicity, this is not considered.
Going Live: Turning Backtests into Real-Time Signals
After a user has tested rules they are comfortable with, they can again clone their strategy and change the mode to live instead of backtest.
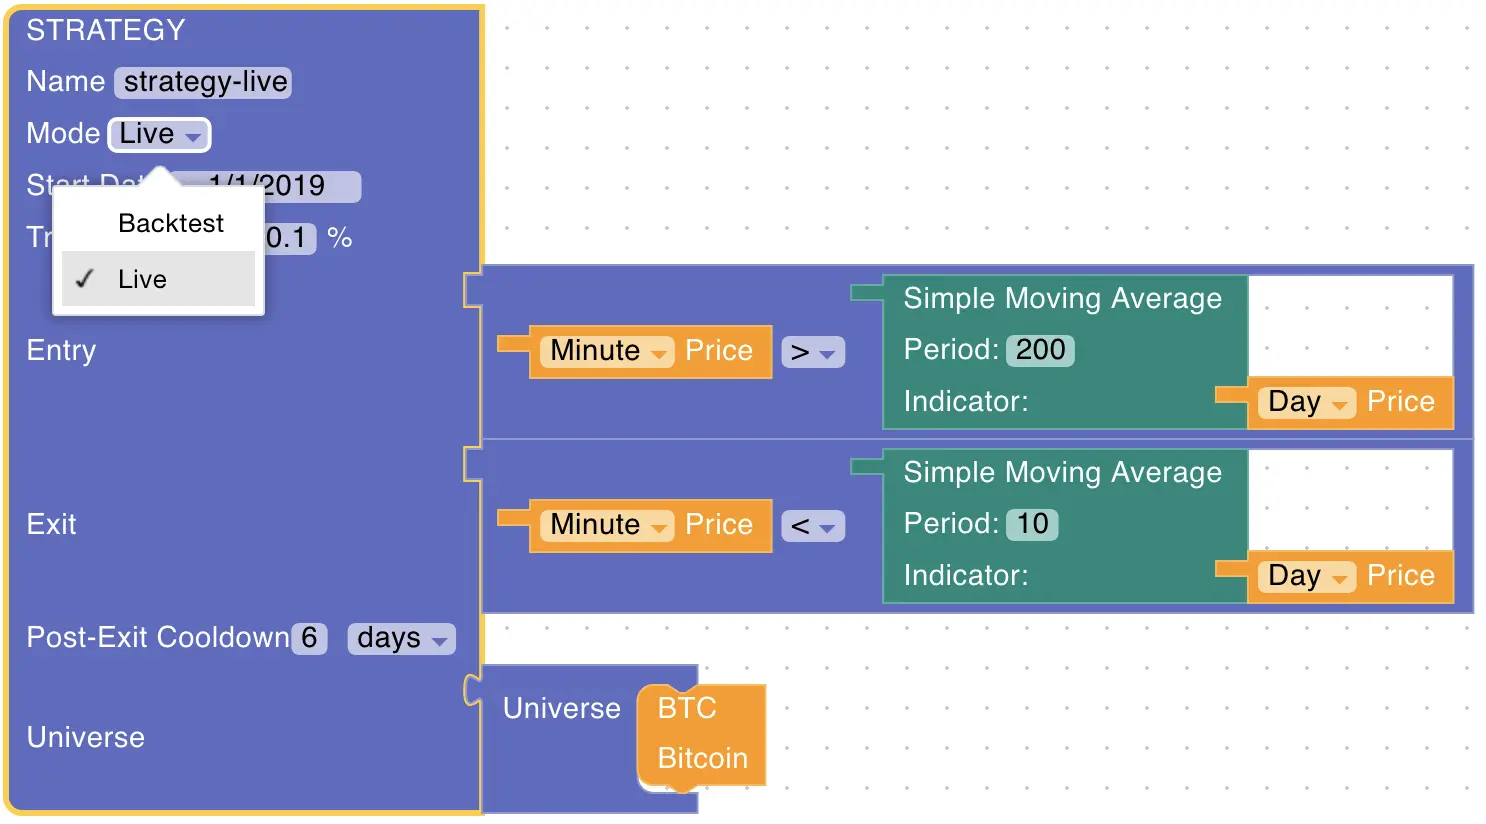
After saving and starting a live strategy, the user will receive notifications of any position changes triggered by the rules in real-time. Rules are evaluated every minute.
The example of position change can be seen below.
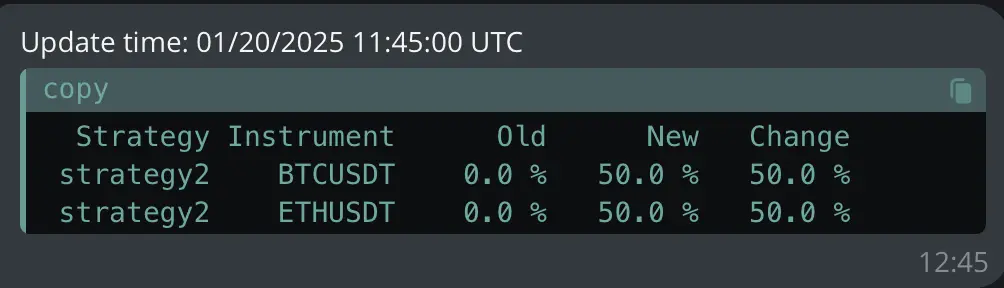
This update informs the user with a strategy that contains 2 instruments that they should go long on both (from a previous flat position).
Conclusion: Can Smart Bitcoin Trading Beat HODLing?
We have shown that using our framework, users are able to test hypothetical trading rules before committing their own capital. This functionality is available for free users; only a free account registration is required.
Postscript
I have gone ahead and shared the live strategy, so that its results can be viewed and inspected by interested readers.
The performance is updated every minute, and you can observe the live updated results here.
Footnotes
-
Benchmark: A standard or point of reference against which investment performance can be measured. In this case, we use the buy-and-hold Bitcoin strategy as our benchmark to evaluate if our trading rules can outperform it. ↩
-
Buy-and-Hold: An investment strategy where an asset is purchased and held for a long period regardless of market fluctuations, based on the belief that long-term prices will rise despite short-term volatility. ↩
-
Sharpe ratio: A measure of risk-adjusted return that indicates the average return earned in excess of the risk-free rate per unit of volatility. Higher Sharpe ratios indicate better risk-adjusted performance. ↩
-
Calmar ratio: A performance measurement that compares the average annual compounded rate of return with the maximum drawdown risk. Higher Calmar ratios indicate better risk-adjusted returns with respect to drawdown risk. ↩
-
Maximum drawdown: The largest percentage drop from a peak to a trough in an investment's value over a specific time period. It measures the biggest loss an investor would have experienced if they bought at the peak and sold at the lowest point. ↩